This is the Family Genetics teaching program GeneShare. It starts with a three-generation family.
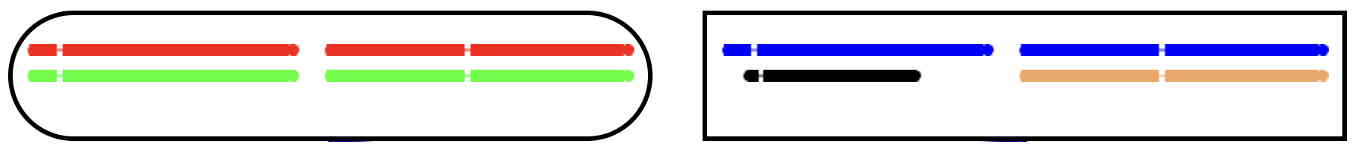
'Genotypes' are shown for 'founder' individuals (grandparents), using two 'chromosomes'.
Because individuals are 'diploid', each has two copies of each chromosome.
The first aim of the program will be to fill in genotypes of other individuals in the family.
Arrows are provided to navigate through the program.
Click the right arrow to continue.
Please start
Correct. Inappropriate chromosome is outlined.
Computer thinks you may have the wrong chromosome. Want to try again?
Inappropriate chromosome indicated.
The next screen will show 'gametes' which will be passed on to produce genotypes for the following generation.
More detailed instructions are shown on the program menu above, which is available at all times.
To produce a gamete, simply click on an individual. A gamete will be shown
below the parent chromosomes.
This is a four generation selfing pedigree, with parents shown.
Please complete the pedigree.
Each parent needs to provide two gametes to the next generation.
The inbred individual in this pedigree needs to be set up in the usual way
using gametes produced by the two parents.
You can now grab this gamete, drag it, and drop it in an offspring of this parent.
Good. You can now go on repeating this process, making gametes and putting them in offspring.
Each time an individual has two sets of chromosomes, it can, in turn, produce gametes.
Please complete the family.
The family is now complete. You can click on a chromosome in one of the individuals of
the final generation (grandchildren) to check on its derivation.
The study of different relationships begins at this point.
The first, and simplest, relationship is between parent and offspring,
Click the arrow to start on this.
Alternatively, use the menu to look at other relationships.
The pedigree is complete. Press the right arrow to continue.
Family is complete. Click arrow to continue.
The pedigree is now complete. We look at what is happening in the inbred individual.
The pedigree is now complete.
Please select related individuals
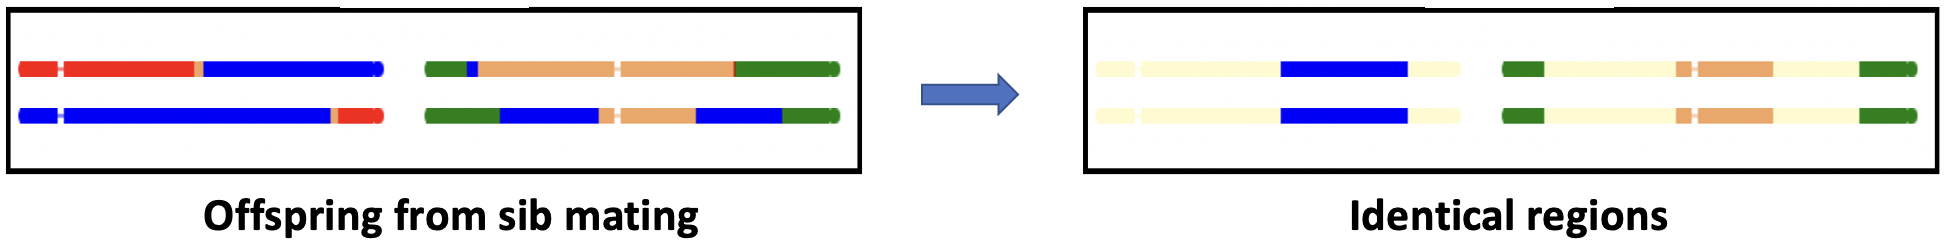
The potentially inbred individual is selected. The next screen will show
just the regions where the female- and male-derived chromosomes are identical.
Parent - Offspring
Please select two individuals, one a parent and the other its offspring.
You can select and unselect by clicking on individuals.
PS. This may be easiest, initially at least, if you click on one of the two original parents and an offspring.
Please select any individual to check on inbreeding.
Please select two individuals.
You can select and unselect by clicking on individuals.
Please select just one individual.
You can select and unselect by clicking on individuals.
Good. The next diagram will make it easier to see how much of the genetic material parent and offspring have in common,
by blanking out regions that are different in the two.
Good. The next diagram will make it easier to see how much of the genetic material these two have in common,
by blanking out regions that are different in the two.
The next diagram will make it easier to see the extent of inbreeding,
by blanking out regions that are different in the two chromosomes.
The diagram now shows colour only for the regions that are shared between parent and offspring.
If you want, you can use the back arrow to see the original colours in these two, and then to see all the original colours.
The diagram now shows colour only for the regions that are shared by both chromosomes in the inbred individual.
If you want, you can use the back arrow to see the original colours, and then to see original colours in all individuals.
The diagram now shows colour only for the regions that are shared between the two individuals.
If you want, you can use the back arrow to see the original colours in these two, and then to see all the original colours.
The diagram now shows original colours only for regions where there are two copies.
The diagram now shows original colours only for regions where there are two copies. But in this case there are NONE.
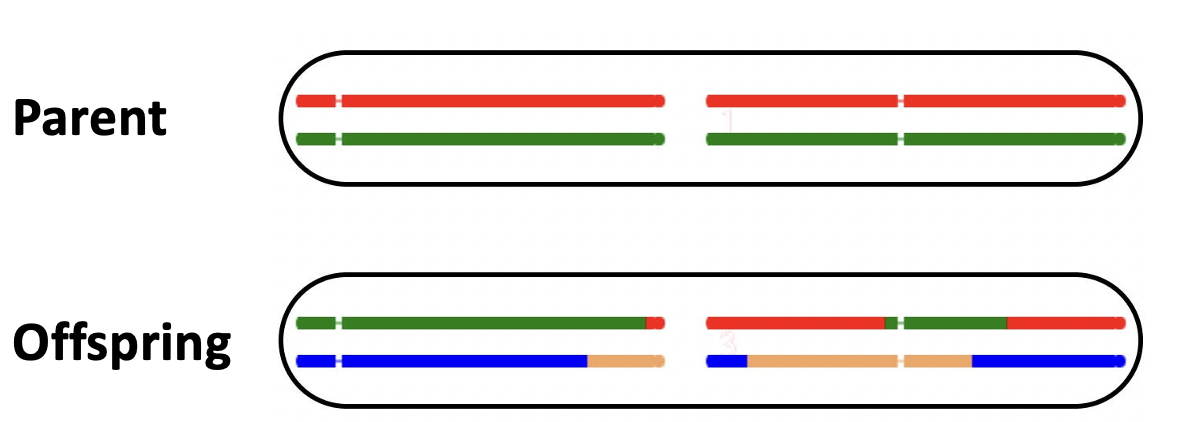
It should be clear that exactly half the genes are shared by parent and offspring. The blocks of shared genes are
identical, except for a few recombination events that break them up.
NB Look at the parent to see where the recombination events occur.
Notice that there is now no exact relationship in genes shared between the two individuals.
It depends on which chromosome is inherited and where the crossovers are. This is different from the
parent-offspring relationship, where the two always share exactly half the genetic material.
The next screen will show the fraction of genes shared graphically.
Just as with the relationship between individuals, the degree of inbreeding,
measured by the inbreeding coefficient, varies for different
individuals with the same ancestry.
The next screen will show the inbreeding coefficient graphically.
Just as with the relationship between individuals, the degree of inbreeding,
measured by the inbreeding coefficient, varies for different
individuals with the same ancestry.
The next screen will show the inbreeding coefficient graphically.
That completes Phase 1, the analysis of the parent-offspring relationship.
You can choose to go back to look at other parent-offspring pairs, or alternatively go on to Phase 2.
In Phase 2, other relationships need to be chosen from the Relationships menu.
Each time you nominate a relationship, eg siblings,
a new pedigree will be generated automatically.
You can also use the New menu to generate new pedigrees, either completed or uncompleted.
It is important to try new pedigrees to check on the relationship. The program allows you to do this.
Clicking the forward button will show the same two individuals but with a new simulated pedigree.
Clicking the forward button will now show a new pedigree.
Clicking the forward button will now show a new pedigree.
nothing
GeneShare
Inbreeding implies the mating of relatives. This section starts with the mating between cousins.
It then looks at closer forms of inbreeding, sib-mating and parent-offspring mating, which are of importance in animal breeding.
Fraction shared(mean)Trial
This pedigree is identical to the previous pedigree
except for the addition of an offspring from mating of the first cousins.
This pedigree shows (full) sib mating.
Genotypes are now shown as previously.
Please drag the gamete to one of the offspring.
Please select an individual to check for effects of inbreeding
(1) Parent - Offspring
Please select two individuals, one a parent and the other its offspring.
Please select two individuals.
Please select an individual.
The next diagram will make it easier to check on inbreeding
Use the back arrow to see complete pedigree
The diagram now shows colour only for the regions that are shared between parent and offspring.
If you want, you can use the back arrow to see the original colours in these two, and then to see all the original colours.
The diagram now shows colour only for the regions that are shared between the two.
If you want, you can use the back arrow to see the original colours in these, and then to see all the original colours.
As previously, at each point along the chromosome, one gene is shared and one is not.
As with relationships, chance plays a role in determining the extent of identical segments.
You can now nominate to look at other relationships, grandparent-grandchild, brother-sister, etc.
Click the forward button to do this.
Alternatively you can use the menu to look at different relationships.
Please choose a relationship:
It is important to try new pedigrees to check on the degree of inbreeding. The program allows you to do this.
Clicking the forward button will show the same individual but with a new simulated pedigree.
Do you wish to start another relationship? Press back arrow if so, or next arrow to continue
The above pedigree should have one chromosome that is
not consistent with the pedigree.
It might be a sex chromosome or it might be chromosome with
colours that are invalid according to its ancestry.
The aim of the quiz is to find and click on that chromosome.
[NB this part of the program is not (yet) fully implemented]
Try to find the inappropriate chromosome in this pedigree
The program now allows you to repeat the simulation, showing just the two indivduals you have selected.
test1
Note that for the final generation, you will need to click the outside, unrelated, parent.
The gamete will not be shown here, just the chromosomes inherited by the offspring.
Please select 2 individuals. You can select and unselect by clicking on individuals.
Please select just one individual.
Sorry that does not look like a valid pair.
Please try again. You can select and unselect by clicking on individuals.
Are you sure that you want to move on from the study of relationships to the study of inbreeding? Press forward arrow to confirm
The exact colours are not important in this program, but if
you have some form of colourblindness or have problems with the chosen colours, you can change them here.
Click on one of the chromosomes below. This will activate the 'colourpicker' box, which you can click to try to
find distinguishable colours. When you have found a suitable colour, click the Accept button to transfer
the colour to the clicked chromosome. Only newly generated chromosomes will show the new colours.
Sex linkage
In this mode, the first of the two chromosomes, on the left, becomes the sex chromosome, either X or Y.
The second chromosome remains a non-sex (autosomal) chromosome.
Females are XX and males XY.
Relationships with Sex linkage
The simulation starts with the same female and male grandparents.
The remaining individuals in the pedigree are a mix of females and males.
In this case, sex is determined by the genotypes inherited from the parents.
If the male parent produces a gamete with the Y chromosome, you will see that this leads to a male offspring.
Similarly an X leads to a female.
IT IS IMPORTANT TO NOTE
that when studying relationships between individuals (or inbreeding), only the second, autosomal, chromosome is taken into account.
There are too many possible X and Y comparisons to easily include the sex chromosome in these calculations.
Inbreeding with Sex linkage
The situation when studying inbreeding is subtly different than when studying relationships.
Now gender matters, in the sense that matings always need to be betwee a female and a male.
Individuals in the pedigree need to inherit the correct sex chromosome
If you see that the gamete contains the incorrect sex chromosome for a particular offspring,
you will need to discard that gamete using the back arrow and produce a new one,
repeating until the correct gamete is produced.
Also, note that sex linkage is not compatible with self-fertilisation.
GeneShare 0.9 - Aims of the program
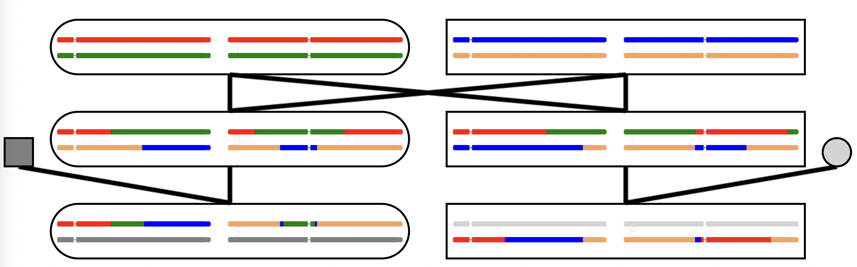
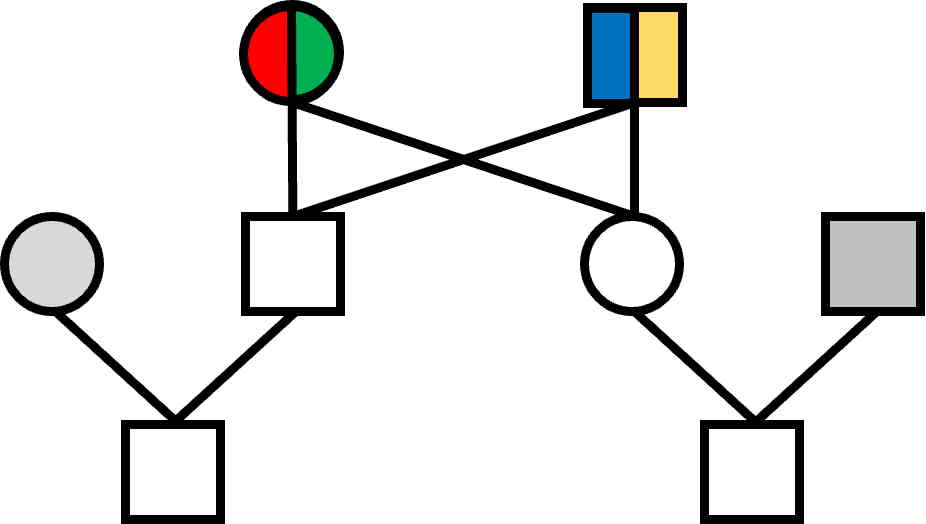
A primary aim of the GeneShare program is to give you a mental picture of what inheritance looks like
when chromosomes are passed from parent to offspring.
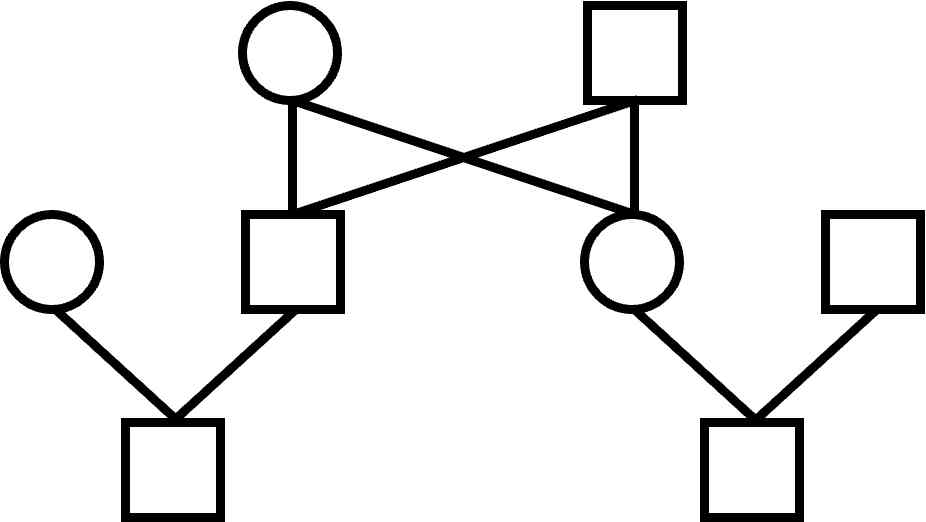
Much of the program is also devoted to looking at the relationship between different individuals of a family.
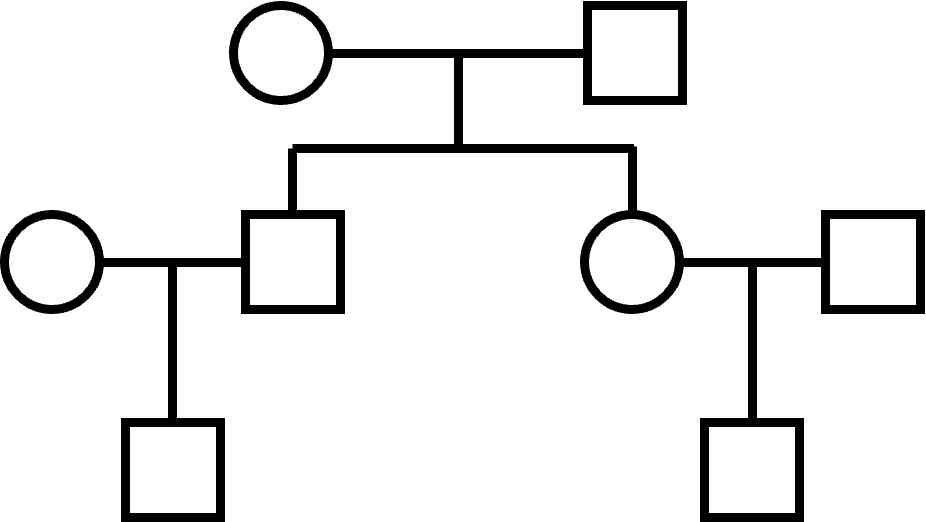
The basic structure is a 3-generation family, pictured above, and in more conventional format, to the right.
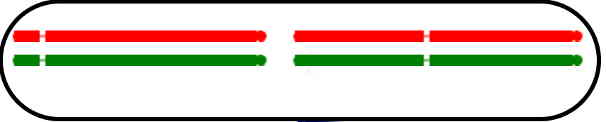
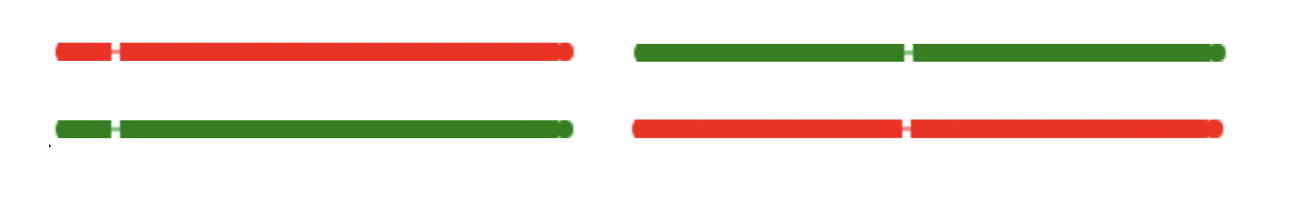
Genotypes and chromosomes
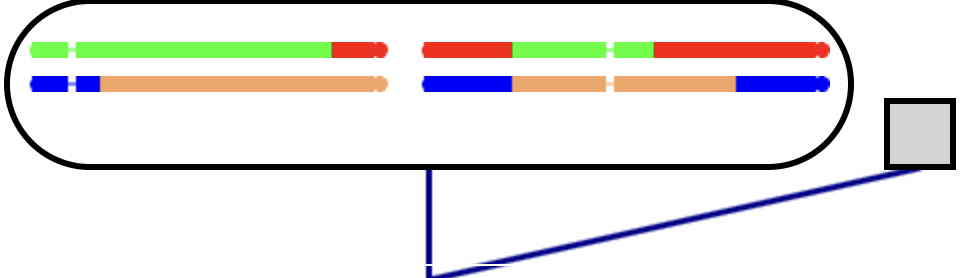
Geneshare shows chromosomes rather than genes.
The genotype of an individual is represented by two chromosomes,
one with centromere close to the end and one with centromere near the middle.
Each is present in two copies,
and the two copies are coloured differently.
Genes are not specifically labelled in this program.
It might help to think of genes as small regions of the chromosome,
each responsible for a character.
GeneShare is a 'simulation' program, taking chance into account.
Each 'run' of the program will generate a different family picture.
Two phases of the program
I. The parent-offspring relationship
Genotypes are built up 'by hand' in this first phase,
allowing you to visualise the inheritance process.
Once the pedigree is complete, individual chromosomes can be selected for a summary of how they are produced.
II. Other relationships
The second phase of the program allows you to study gene sharing for all types of relationships.
Families are built automatically in this phase so that multiple pedigrees can be studied.
This phase also introduces inbreeding and sex linkage.
There is a quiz that you can take once you have tried sex linkage.
Gene sharing
You probably already know from Mendel's laws that if an individual contains a particular gene,
there is a 50% chance that this gene will be passed on to an offspring.
Another way of expressing this
is that parent and offspring share 50% of their genes.
Gene sharing is much less obvious for other relationships, eg brother and sister (siblings), or first cousins.
You will also see that while parent and offspring always share 50% of their genes,
there is no exact fraction shared for other relationships.
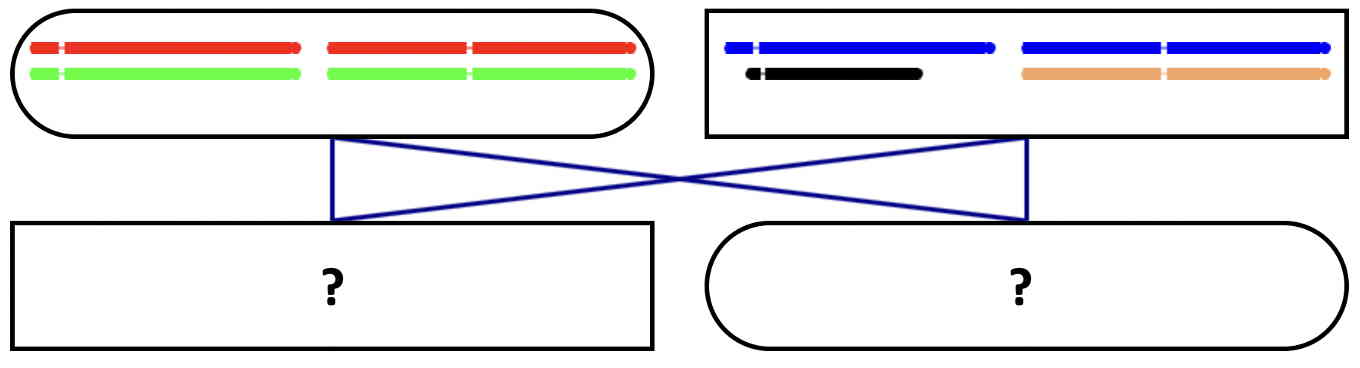
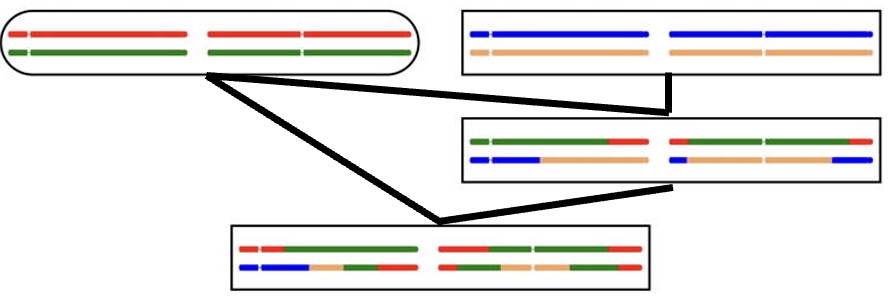
Making gametes and genotypes
All individuals are 'diploid', carrying two copies
of each chromosome.
The different colours used for the two chromosomes allow
each, or pieces of each, to be followed throughout the simulation.
Gametes contain just one of each chromosome.
They are produced by simply clicking on an individual.
The gamete is moved to an offspring by clicking on it, dragging it to an offspring,
and releasing it.
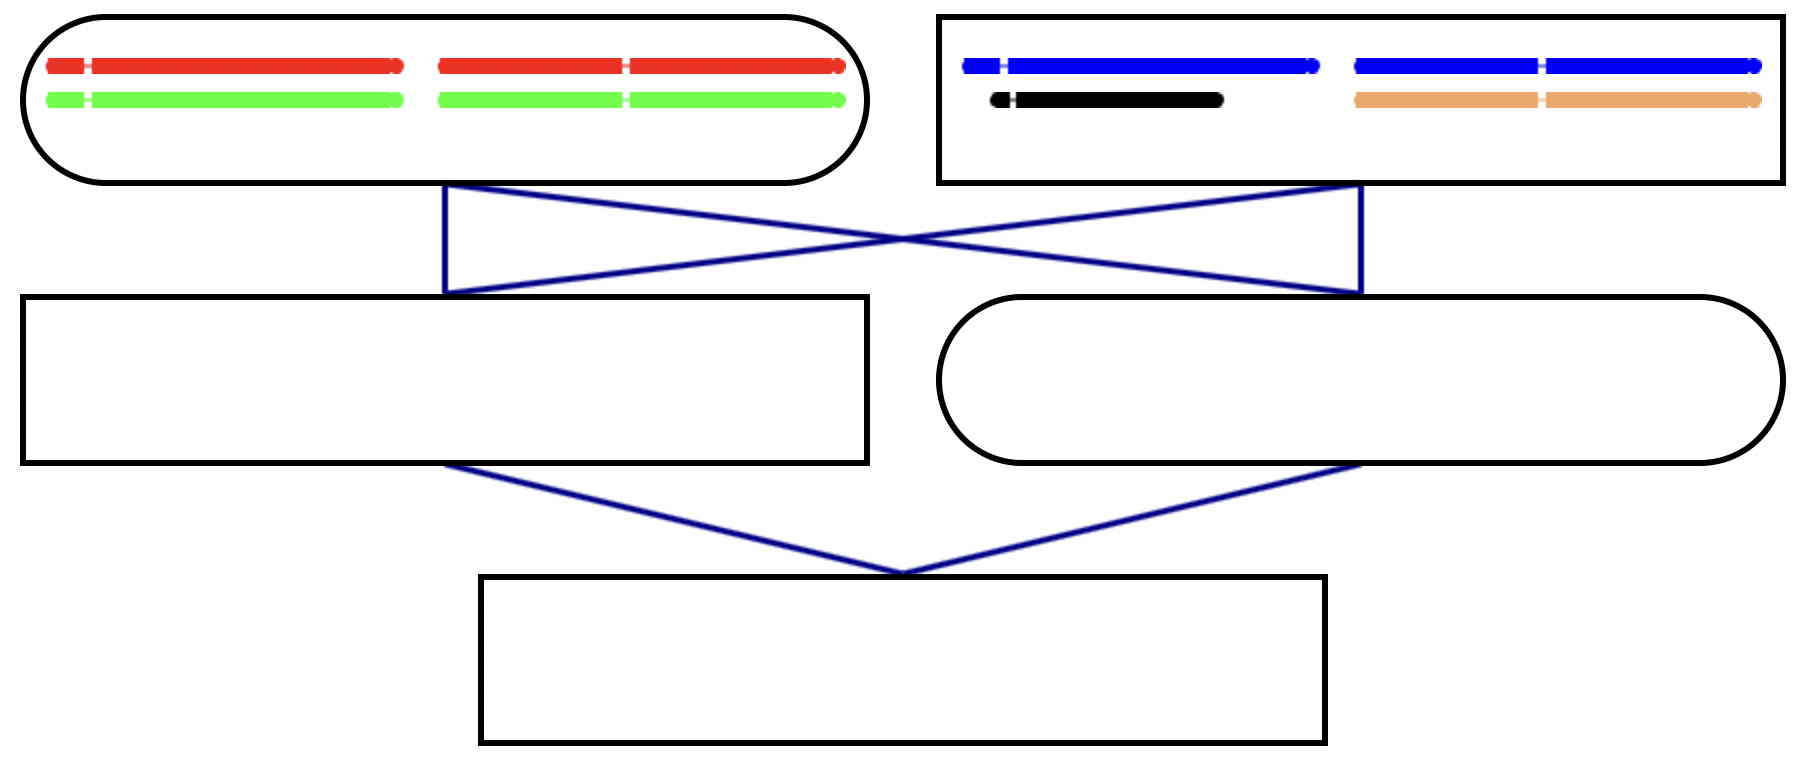
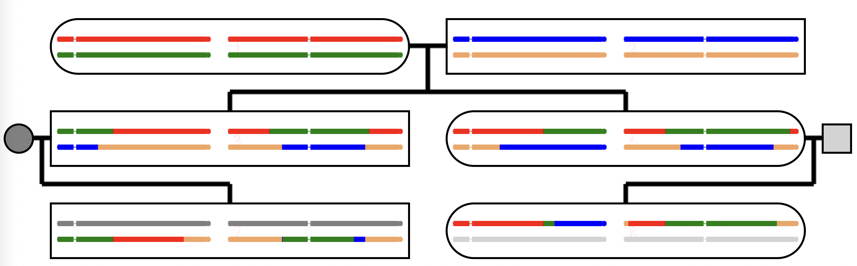
Making gametes and genotypes (2)
The genotype of an individual is complete when it has received a chromsosome from both the female and male parent.
It can then be clicked to produce gametes of its own.
The final individuals in the pedigree inherit one gamete from the outside (gray) individuals.
Gametes will not be seen here, just the genotypes in the final individuals.
At any stage you can go back in the program, to remove the last gamete.
This can be done either before or after the gamete has been assigned to an offspring.
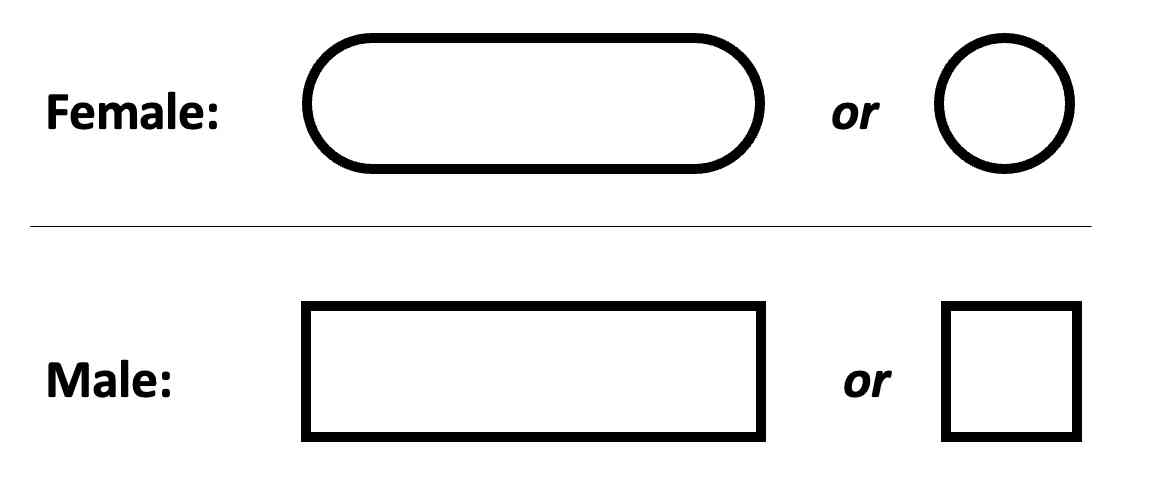
Drawing the pedigree
Females and males are designated in the pedigree as shown below.
The space-saving compressed form is used where genotypes are not shown.
Two ways of drawing a pedigree
Conventionally, the pedigree shown in the program would be drawn in the form:
With this method it is easy to see the matings, joined by single horizontal lines.
The alternative form, as used in GeneShare,
is more useful when studying inheritance.
The passage of genes from parent to offspring uses a single line,
rather than two, three or even four lines - much easier to follow.
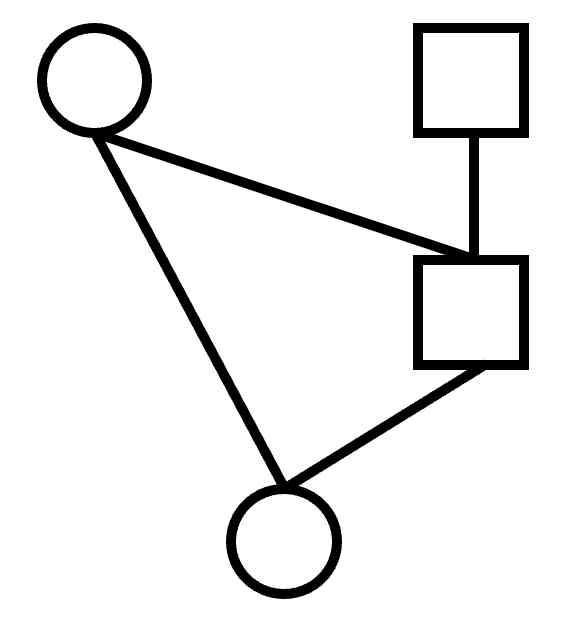
Pedigrees with complex generation structure
There are some pedigrees with overlapping generation structure that are impossible to draw with horizontal lines.
An important pedigree in animal breeding involves mating an offspring to one of the parents.
This can readily be drawn in the alternative form:
Try to draw this pedigree using just horizontal and vertical lines.
There's no easy way to do it.
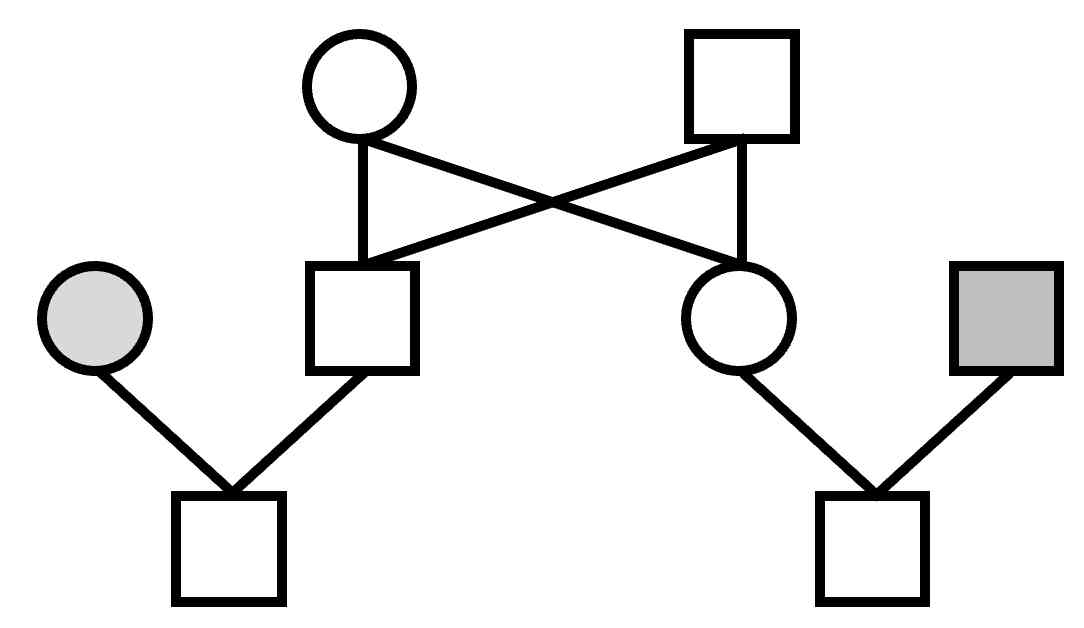
Shaded versus unshaded
Note that all unshaded individuals in the pedigree are related to each other.
The shaded individuals are related only to their own offspring.
This makes them of less interest when studying relationships.
It is also the reason that they can be drawn in the smaller, space-saving, form.
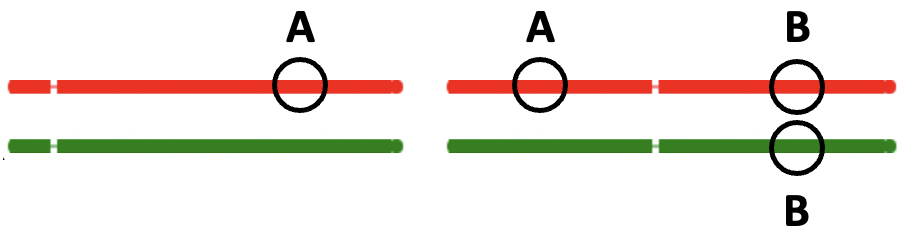
The use of four colours
It is convenient to use four distinguishable colours in the GeneShare pedigrees.
Don't, however, be misled into thinking that colour has anything to do
with the function of the gene.
If this were true, then in the diagram below, gene regions labelled A of the same colour
should be similar, while gene regions labelled B should be different.
The reality, of course, is the opposite. Genes of the two regions labelled as A have nothing to do with each other,
while genes of B are just 'allelic variants' of each other.
Different chromosomes are independent of each other.
In fact, the chromosomes in the previous figure
could equally have been pictured as:
Why four colours are enough
Four colours are enough for this pedigree, ignoring the gray colours.
The reason relates to the number of 'founder' individuals in the pedigree.
Here there are only two, the grandparents, each of whom requires two colours.
Other individuals in the pedigree, excepting the outside ones, are descendants.
Pedigrees having more that two founder individuals would require additional colours.
The exact colours are not important in this program.
If you have some form of colourblindness or have problems with the chosen colours,
you can change them by clicking HERE.
Some rules of the program
One gamete at a time
Once a gamete has been produced, nothing else will work until that gamete
has been passed on to a legitimate offspring.
The only other option is to click the back button to cancel that gamete.
For simplicity, gametes can only be produced from an individual if needed for an offspring.
For example, an initial individual in the pedigree (grandparent) has produced gametes
for both of its offspring, no more gametes can be produced.
The program follows the convention that any gamete coming from the female goes
to the upper position in the genotype, and from the male to the lower position.
In real life, with a few exceptions, known as imprinting, it does not matter whether
the gene comes from the female or male parent
Some rules of the program (2)
Crossovers and recombination
In this program, for simplicity, each gamete will have one recombination point
in the long arm of the first chromosome.
There is also usually, but not always, a recombination point in each arm of the second chromosome.
You can find out more about crossingover and recombination in the Theory menu.
Full screen
The program allows full screen mode to be selected from the GeneShare menu. This can be reversed
either from the menu or in the usual way using the "esc" key.
Exit from information screens
You can also use the GeneShare menu
to exit from any of the information screens, to return to the simulations.
Drawing the pedigree
Pedigrees are usually drawn in the form:
This method uses horizontal lines to emphasise the mating.
The alternative form, as used in GeseShare,
makes it easier to follow the passage of genes from parent to offspring.
There are some pedigrees with overlapping generation structure that are impossible to draw with
just horizontal and vertical lines.
An important pedigree in animal breeding involves mating an offspring to one of the parents.
This can readily be drawn in the alternative form:
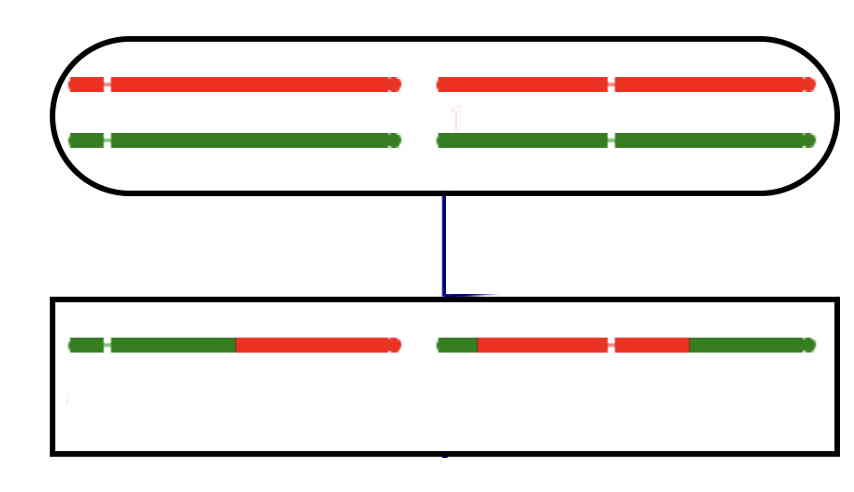
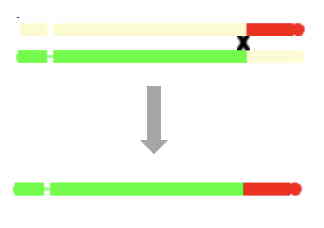
Showing the crossovers
You should now see just the chromosome you have clicked,
together with the equivalent chromosome in the founder individuals.
All other chromosomes will be dimmed.
Clicking the right arrow multiple times should now take you through the steps
to show how the chosen chromosome was produced.
Use the back and forward arrows to show how recombination events lead to the selected chromosome
The last stage. Click the forward arrow to return to the pedigree.
What is a gene?
The aims of this program have been expressed in terms of genes.
For example, what fraction of your genes come from a particular grandparent?
But you probably will have noted that this program, despite its name, pictures chromosomes rather than genes.
Why the emphasis on genes?
The reason is that there is a long history in which the 'gene' has been denoted as the basic unit of inheritance.
But genes are, in fact, conceptual entities that cannot be visualised directly.
This is not true for DNA and chromosomes.
DNA, chromosomes and genes
DNA is the basic molecule controlling inheritance and can be directly studied biochemically.
DNA is packaged into chromosomes, entities that can be seen under the microscope.
Genes, on the other hand, can't be visualised directly.
For the purposes of this program
it is convenient to think of genes as just regions on chromosomes.
From the point of view of inheritance, it is chromosomes, or parts of chromosomes,
that are passed from parent to offspring.
What is a gene? (2)
If you read the genetics literature, you will find that use of the term "gene" is somewhat controversial.
A recent article,
The Evolving Definition of the Term "Gene",
summarises how the definition of the term has changed over time,
and what it means now.
Consequently there is a tendency to avoid use of the term altogether.
You will rarely see expressions such as "the gene for ...." in research journals.
Use of the term "frequency of the ... gene" is frowned on.
The traditionally used term "locus", a location on the chromosome,
is probably still acceptable. So is the term "allele", an alternative (gene?) at a locus.
But "allele" also has its limitations when discussing "alleles" at more than one locus.
An allele at a first locus and an allele at a second locus are not, strictly speaking, alleles.
In summary, terms such as "gene sharing" might not be acceptable
if submitted to a research journal. Hopefully they are understood in the genetic simulations here.
Genetic relationships and inbreeding - Malécot's coefficient (Advanced topic)
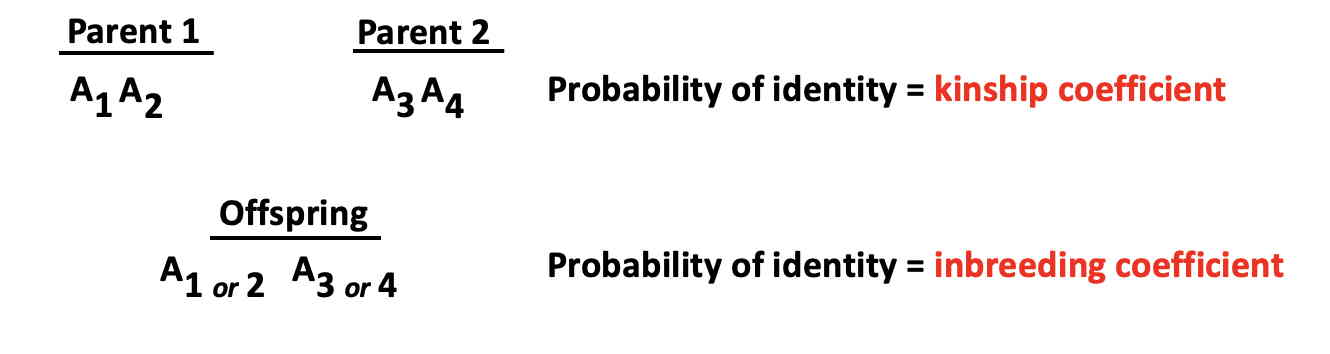
The essence of Malécot's kinship coefficient for a single locus is that it directly connects relationship
of parents with inbreeding of offspring.
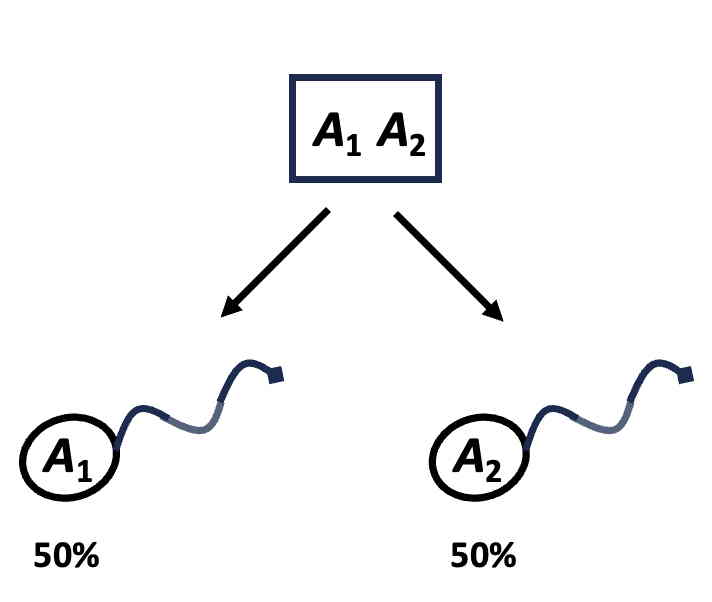
The coefficient is defined as the probability that two randomly selected genes will be identical.
This mimics the Mendelian inheritance process, in which an offspring
contains two randomly selected genes from its parents.
This is illustrated in the diagram in which alleles labelled as
A1 and A2
may, with a certain probability, be identical with alleles labelled as
A3 and A4
In other words, the kinship coefficient of two parents is equal to
the probability that the two genes of an offspring will be identical,
which is the inbreeding coefficient (F).
Closeness of genetic relationships and inbreeding
As you will have realised by now, the topics of genetic relationships between individuals
and inbreeding are very closely related.
By definition, inbreeding results from the mating between related individuals.
The closer the relationship, the greater the amount of inbreeding.
This figure illustrates inbreeding for three simple relationships, including the possibility of self-fertilisation in plants.
In this figure the genes A1, A2, A3 and A4
are assumed to be unrelated, and inbreeding comes from the crosses in the pedigree.
Inbred individuals and their parents are shown in red. The number of generations
separating the two parents from their common ancestor(s) is shown in parentheses.
The total probability of identity, which is the inbreeding coefficient, is shown for offspring.
Evidently the more closely related the parents, the higher the inbreeding in the offspring.
Measuring inbreeding - Calculation of the inbreeding coefficient (F)
The common measure of inbreeding, the inbreeding coefficient, is just
the fraction of the genome that is identical by descent from a common ancestor or ancestors.
It is usually given the designation F.
In the example above it looks like F is between 0.3 and 0.4.
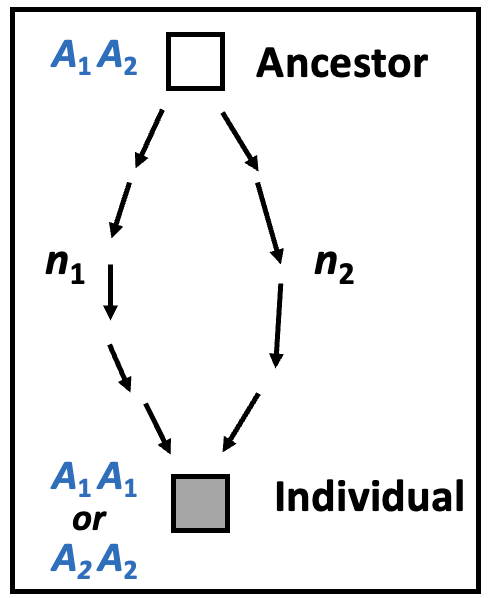
Inbreeding results from mating of related individuals.
The expectation for inbreeding for a single locus
is shown on the right, with
an inbred individual and a single ancestor known as a 'common ancestor'.
Because the parents of the inbred individual are related, there must be at least two pathways from a common ancestor.
The individual is separated from this common ancestor by n1
and n2 generations respectively, which may be different.
Each allele, A1 or A2,
has probability ½ of being passed on in each generation.
The overall probability of either allele being passed to the individual on both pathways is therefore
(½)n1+n2. To take account of the fact that
there are two possible alleles, this value must be doubled, giving
(½)n1+n2-1.
Measuring inbreeding - First cousins
There are two common ancestors, the two great-grandparents, shown here
with the contribution from the female great-grandparent highlighted.
Substituting 3 for n1 and n2 from the figure of the previous page gives
the contribution to inbreeding as
(½)3 + 3 - 1 = 1/32.
Summing this with the equal contribution from the male great-grandparent gives the total inbreeding coefficient as 1/16.
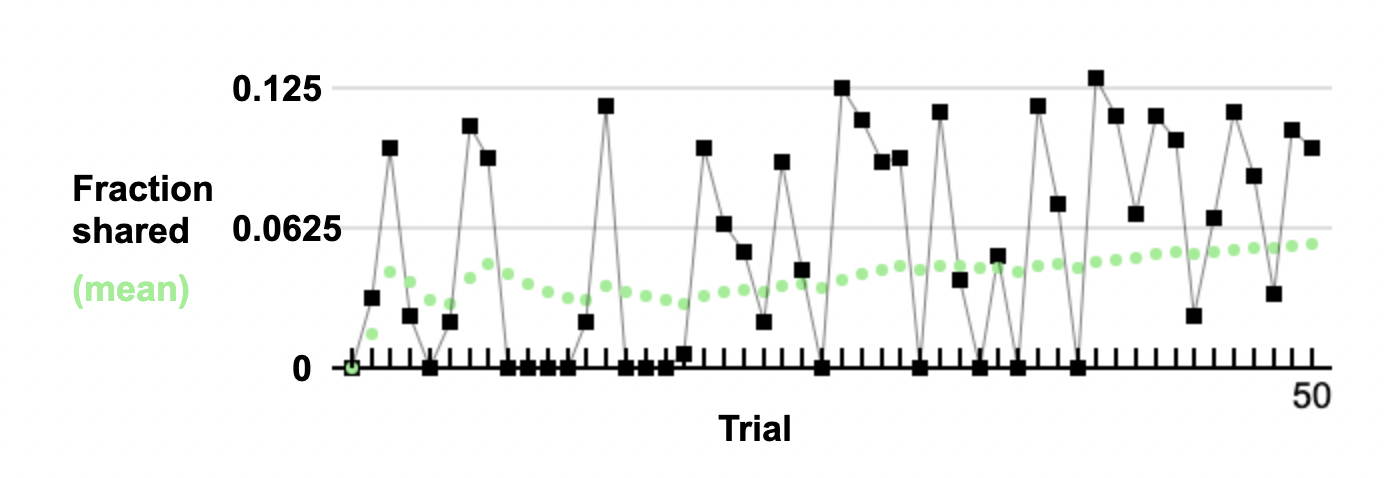
First cousin inbreeding - individual cases
Simulations show that, by chance, different individuals have differing
degrees of inbreeding. The diagram below shows the variation in inbreeding for a set of first cousin mating.
The mean is close to expectation. The variation is very high, with many individuals having
no inbreeding at all.
This variation would be substantially less for a higher number of chromosomes, eg 26 in humans.
Inbreeding depression
Why is inbreeding important?
Numerous studies dating from those of Charles Darwin have shown that inbreeding is deleterious
in organisms that normally outbreed.
What inbreeding does at the genetic level is that it increases the number of homozygous genotypes
and decreases the number of heterozygous genotypes.
The fact that inbreeding is deleterious means that
heterozygous genotypes are, on average, better than homozygous genotypes.
Deleterious recessives
The usually accepted reason for this disadvantage of homozygotes is the existence of deleterious recessive genotypes.
There are many cases in humans of genetic diseases such as
cystic fibrosis, sickle cell anaemia etc, all of which
only occur if the genotype is homozygous.
Individually they are rare, presumably because they are deleterious.
But there are potentially many genes subject to recessive mutation of this kind.
It is still an open question as to whether inbreeding depression is entirely due to
deleterious recessive genotypes.
The alternative model is that at some loci, heterozygous genotypes are
advantageous over both homozygous genotypes.
The population implications of the two models are very different.
Deleterious genes are likely to be rare in populations.
By contrast, at loci where there is heterozygote advantage, both deleterious
homozygous genotypes can be at high frequency.
Currently, however, few cases are known of such loci.
Measuring inbreeding - DNA and Runs of Homozygosity (ROH) (Advanced topic)
The ease of DNA sequencing has opened up the possibility of directly estimating inbreeding.
In species for which a genome sequence is available,
runs of homozygosity in an individual can be measured directly.
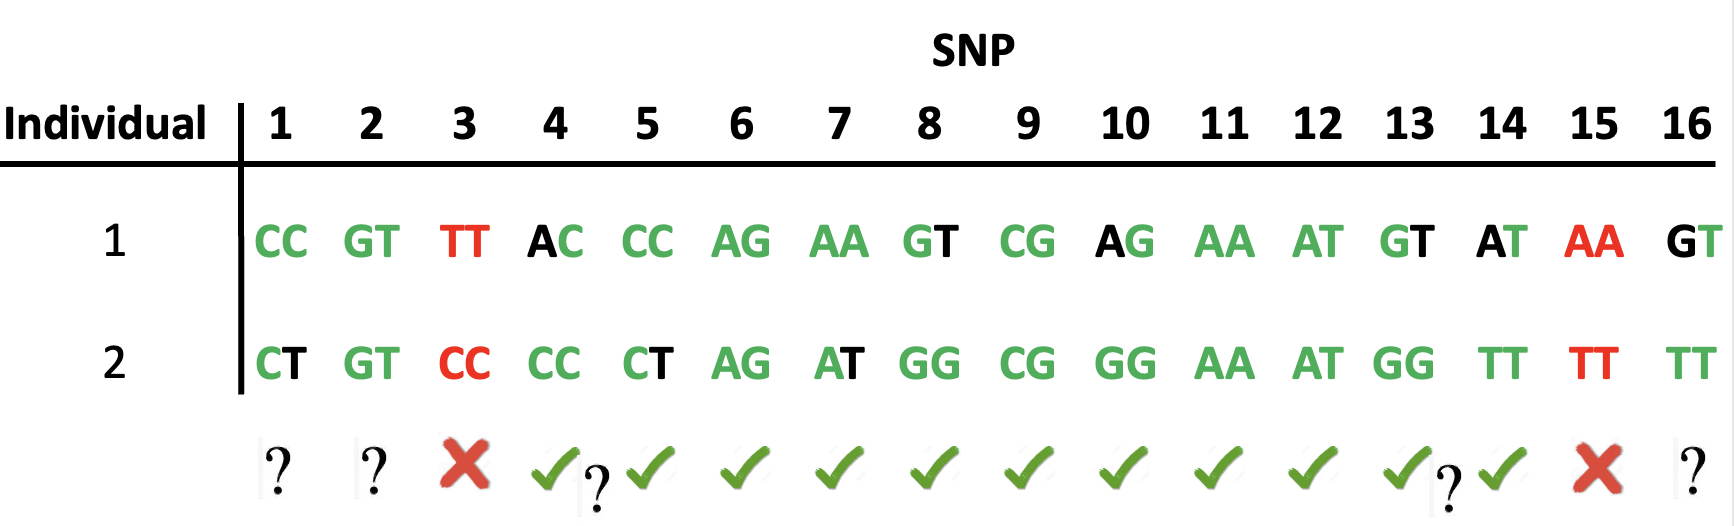
Sites in the DNA where differences have been found in populations are denoted as SNPs,
Single Nucleotide Polymorphisms.
These just have to be shown to be homozygous
in an individual, ie AA, CC, GG or TT.
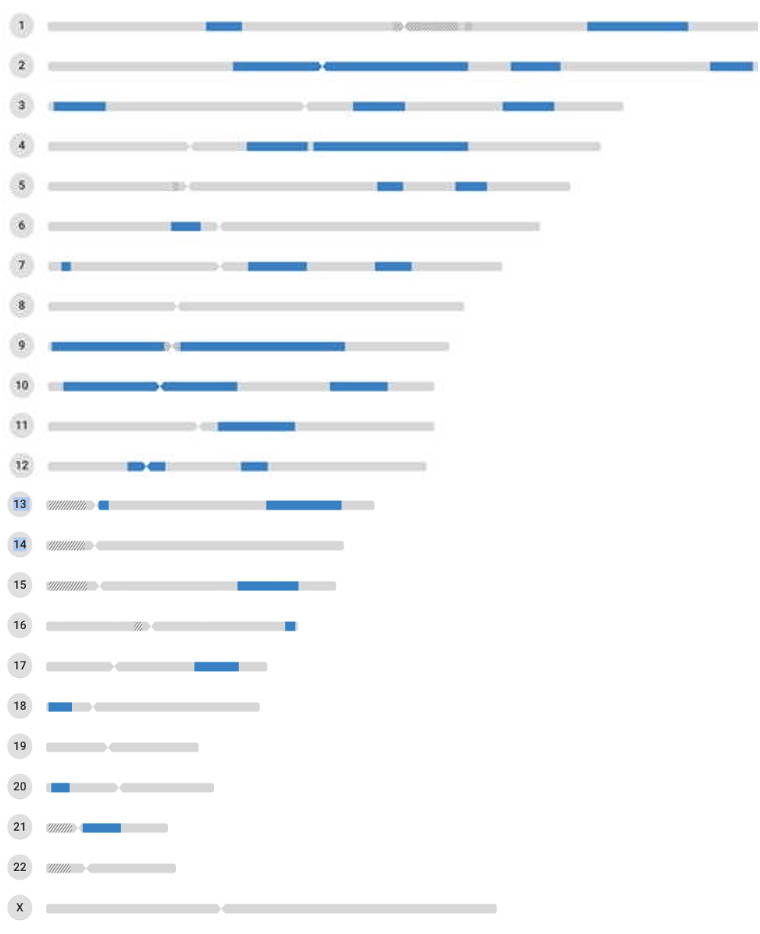
A closely related topic is the detection of matched sequences in humans.
You may have submitted your DNA to a commercial DNA sequencing company, and found that
it was possible to detect relatives by DNA homology.
The figure shows an example of the matching of the 22
autosomes and X chromosome for a first-cousin relationship.
ROH can be measured directly from DNA sequences of an individual.
What about comparing DNA strands from two different individuals?
We have the diploid genotype at each SNP,
but we don't know the 'haploid genotypes', ie what the individual DNA strands actually are.
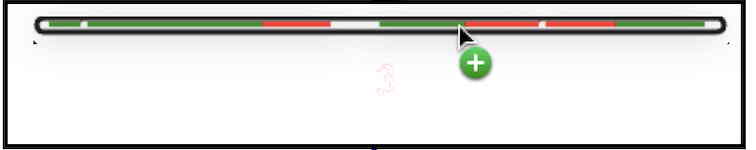
The diagram below shows that if there are enough SNPs,
it is nevertheless possible to tell approximately where single-strand
matching starts and ends, without fully knowing the DNA sequences.
Measuring relationships
In this program, we have measured the degree of relationship as "the fraction of genes shared by two individuals".
On the surface, this looks very straightforward. Parent and offspring share half their genes,
grandparent and grandchild share one quarter on average, etc.
What could be simpler?
But if you study the genetics literature, you will come across a second measure.
Furthermore, this second measure has become the commonly used one.
(1) Wright's measure. This is essentially the measure we have used.
It is due to the population geneticist Sewall Wright (1889 - 1988),
and originally denoted the 'Coefficient of Relationship'.
Wright's derivation uses a method called 'Path Coefficients',
a method that has not been widely adopted.
(2) Malécot's measure.
This measure, due to the French mathematical geneticist Gustave Malécot (1911 - 1988) is
denoted the 'Coefficient de Parenté', sometimes translated as the 'Coefficient of Kinship'.
Malécot's approach is a much simpler probability measure, and it has become the standard method of calculation.
The method is explained in following pages.
The coefficient de parenté (kinship) (Advanced topic)
This is defined as follows for two individuals. Consider the two alleles at a single locus:
Choose one of the two alleles at random from Individual 1
Choose one of the two alleles at random from Individual 2
What is the probability that they are identical (derived from the same ancestral gene)?
An example Individual 1 is A1A2 Individual 2 is A1A3
The probability of identity (coefficient de parenté) is the probability of drawing the A1 twice,
ie ½ x ½ = 0.25.
The downside of the coefficient de parenté A1A2 and A1A3
share half their genes, as would parent and offspring.
Wright's coefficient of relationship would be 0.5.
In general, Wright's coefficient is 2 x Malécot's coefficient.
More problematically, the coefficient de parenté for identical twins is 0.5.
These have a coefficient of relationship of 1, which seems a more appropriate value.
The coefficient de parenté with inbreeding (Advanced topic)
With genotypes such as A1A2 and A1A3,
both Wright's coefficient and Malécot's are clear.
But what about two individuals A1A1 and A1A2?
Inbreeding is involved in this case, where the two alleles in the first individual are identical.
Here, it is not clear what fraction of genes are shared (Wright's coefficient of relationship).
However it is readily seen that Malécot's coefficient de parenté is equal to ½.
Furthermore, the latter coefficient can readily be extended for calculations over multiple genertions.
It is this facility that makes it the method of choice for calculations of relationships.
As an example, the next screen shows a pedigree of parent-offspring mating, an important mating in animal breeding:
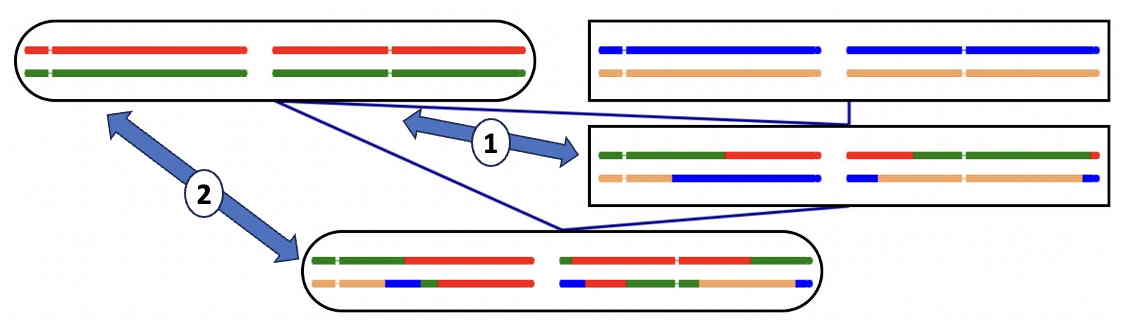
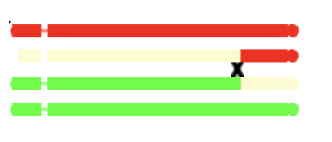
Calculation for Parent-Offspring mating (Advanced topic)
The final individual in this pedigree comes from an offspring mated to a parent.
Comparison (1) shows the normal parent-offspring comparison, with 50% gene sharing;
only one offspring chromosome is shared with the parent.
Comparison (2), on the other hand, shows that both offspring chromosomes share genes with the parent.
Clearly the gene sharing in this case is higher than 50%
As previously, it is not easy to put a figure on Wright's coefficient of relationship.
However Malécot's kinship coefficient can be calculated,
and comes to 3/8, a 50% increase over the value of 1/4 for the normal parent-offspring relationship.
The essential advantage of Malécot's coefficient is that it is unaffacted by inbreeding.
The offspring in comparison (2) is inbred, as it contains segments where the
two chromosome share genes.
The special case of siblings (Advanced topic)
The comparison of siblings in the simulations focuses on the identity of single DNA stretches.
The diagram below shows an additional comparison, DNA stretches where both stretches
are identical.
Note that when parent and offspring are compared, it is not possible for both strands to be identical by descent
Sibs share half their genes, as do parent and offspring, so the comparisons should be similar.
However if, for example, the region in question contains a recessive gene, both sibs can
carry the same recessive phenotype, whereas, in general, parent and offspring do not.
If you study quantitative genetics, you will already know something similar.
The correlation between sibs
contains a component from the dominance variance, a component that is absent from the parent-offspring correlation.
Crossingover and recombination
If you have clicked on chromosomes in the program to see how they are produced,
you will see diagrams such as the following:
Such diagrams are oversimplifications in one respect, in that crossingover actually occurs
after chromosomes have duplicated.
So crossingover occurs at the '4-strand' stage, as pictured here.
Each crossover event, however. involves only two of the four strands.
The non-recombinant strands are not relevant if, by chance, they have not been passed on to the gametes,
so can essentially be ignored.
The GeneShare program contains one unrealistic assumption.
It assumes that the first large chromosome arm always contains one crossover.
In practice, such an outcome would not be possible.
If there is one recombination event, or "chiasma" per arm,
only 50% of gametes would contain a recombination event.
Even if there are two "chiasmata" per arm, it is expected that
25% of gametes would not contain a recombination event (and 25% would contain two).


 Correct. Inappropriate chromosome is outlined.

 Much of the program is also devoted to looking at the relationship between different individuals of a family.
The basic structure is a 3-generation family, pictured above, and in more conventional format, to the right.
Much of the program is also devoted to looking at the relationship between different individuals of a family.
The basic structure is a 3-generation family, pictured above, and in more conventional format, to the right.
 I. The parent-offspring relationship


 The final individuals in the pedigree inherit one gamete from the outside (gray) individuals.
Gametes will not be seen here, just the genotypes in the final individuals.
The final individuals in the pedigree inherit one gamete from the outside (gray) individuals.
Gametes will not be seen here, just the genotypes in the final individuals.
 The reality, of course, is the opposite. Genes of the two regions labelled as A have nothing to do with each other,
while genes of B are just 'allelic variants' of each other.
The reality, of course, is the opposite. Genes of the two regions labelled as A have nothing to do with each other,
while genes of B are just 'allelic variants' of each other.
 Four colours are enough for this pedigree, ignoring the gray colours.
The reason relates to the number of 'founder' individuals in the pedigree.
Here there are only two, the grandparents, each of whom requires two colours.
Other individuals in the pedigree, excepting the outside ones, are descendants.
Pedigrees having more that two founder individuals would require additional colours.
Four colours are enough for this pedigree, ignoring the gray colours.
The reason relates to the number of 'founder' individuals in the pedigree.
Here there are only two, the grandparents, each of whom requires two colours.
Other individuals in the pedigree, excepting the outside ones, are descendants.
Pedigrees having more that two founder individuals would require additional colours.
 This method uses horizontal lines to emphasise the mating.
 In other words, the kinship coefficient of two parents is equal to
the probability that the two genes of an offspring will be identical,
which is the inbreeding coefficient (F).
In other words, the kinship coefficient of two parents is equal to
the probability that the two genes of an offspring will be identical,
which is the inbreeding coefficient (F).
 This figure illustrates inbreeding for three simple relationships, including the possibility of self-fertilisation in plants.
In this figure the genes A1, A2, A3 and A4
are assumed to be unrelated, and inbreeding comes from the crosses in the pedigree.
This figure illustrates inbreeding for three simple relationships, including the possibility of self-fertilisation in plants.
In this figure the genes A1, A2, A3 and A4
are assumed to be unrelated, and inbreeding comes from the crosses in the pedigree.
 Inbreeding results from mating of related individuals.
The expectation for inbreeding for a single locus
is shown on the right, with
an inbred individual and a single ancestor known as a 'common ancestor'.
Inbreeding results from mating of related individuals.
The expectation for inbreeding for a single locus
is shown on the right, with
an inbred individual and a single ancestor known as a 'common ancestor'.
 There are two common ancestors, the two great-grandparents, shown here
with the contribution from the female great-grandparent highlighted.
Substituting 3 for n1 and n2 from the figure of the previous page gives
the contribution to inbreeding as
(½)3 + 3 - 1 = 1/32.
Summing this with the equal contribution from the male great-grandparent gives the total inbreeding coefficient as 1/16.
There are two common ancestors, the two great-grandparents, shown here
with the contribution from the female great-grandparent highlighted.
Substituting 3 for n1 and n2 from the figure of the previous page gives
the contribution to inbreeding as
(½)3 + 3 - 1 = 1/32.
Summing this with the equal contribution from the male great-grandparent gives the total inbreeding coefficient as 1/16.
 The mean is close to expectation. The variation is very high, with many individuals having
no inbreeding at all.
This variation would be substantially less for a higher number of chromosomes, eg 26 in humans.
The mean is close to expectation. The variation is very high, with many individuals having
no inbreeding at all.
This variation would be substantially less for a higher number of chromosomes, eg 26 in humans.
 A closely related topic is the detection of matched sequences in humans.
You may have submitted your DNA to a commercial DNA sequencing company, and found that
it was possible to detect relatives by DNA homology.
The figure shows an example of the matching of the 22
autosomes and X chromosome for a first-cousin relationship.
A closely related topic is the detection of matched sequences in humans.
You may have submitted your DNA to a commercial DNA sequencing company, and found that
it was possible to detect relatives by DNA homology.
The figure shows an example of the matching of the 22
autosomes and X chromosome for a first-cousin relationship.

 Sibs share half their genes, as do parent and offspring, so the comparisons should be similar.
However if, for example, the region in question contains a recessive gene, both sibs can
carry the same recessive phenotype, whereas, in general, parent and offspring do not.
Sibs share half their genes, as do parent and offspring, so the comparisons should be similar.
However if, for example, the region in question contains a recessive gene, both sibs can
carry the same recessive phenotype, whereas, in general, parent and offspring do not.
 Each crossover event, however. involves only two of the four strands.
The non-recombinant strands are not relevant if, by chance, they have not been passed on to the gametes,
so can essentially be ignored.
Each crossover event, however. involves only two of the four strands.
The non-recombinant strands are not relevant if, by chance, they have not been passed on to the gametes,
so can essentially be ignored.
The first aim of the program will be to fill in genotypes of other individuals in the family. Arrows are provided to navigate through the program. Click the right arrow to continue.